Our company conducts research of hazardous zones and dangerous geological processes based on the interpretation of satellite images, including monitoring of processes during a given period of time and retrospective analysis.
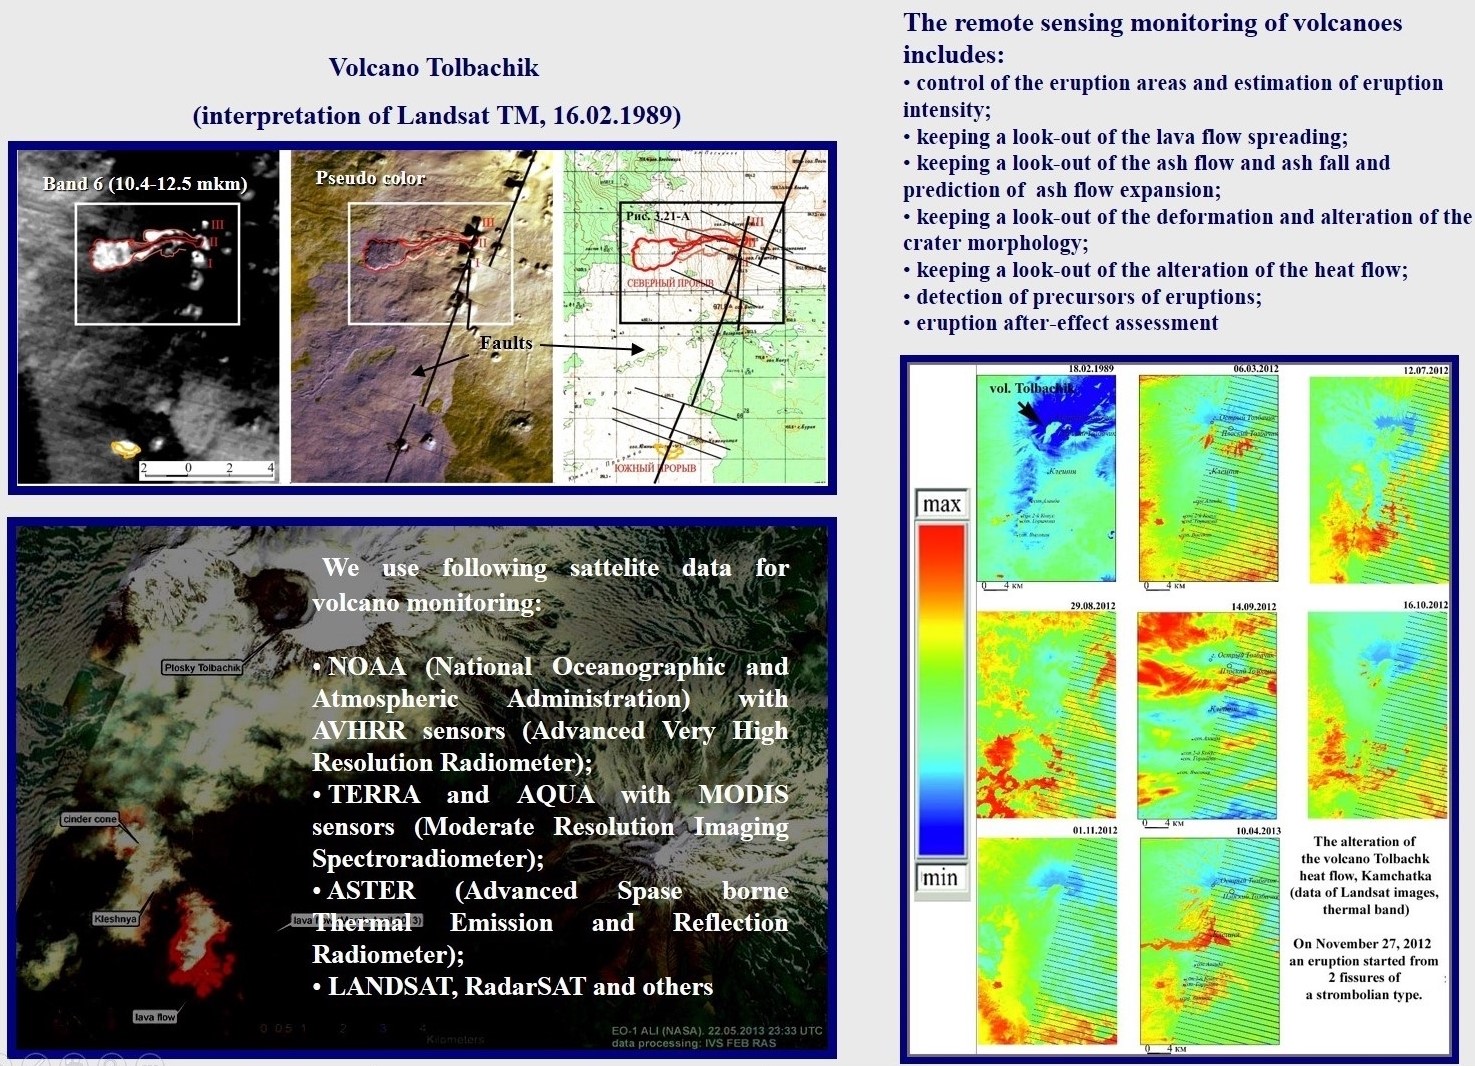
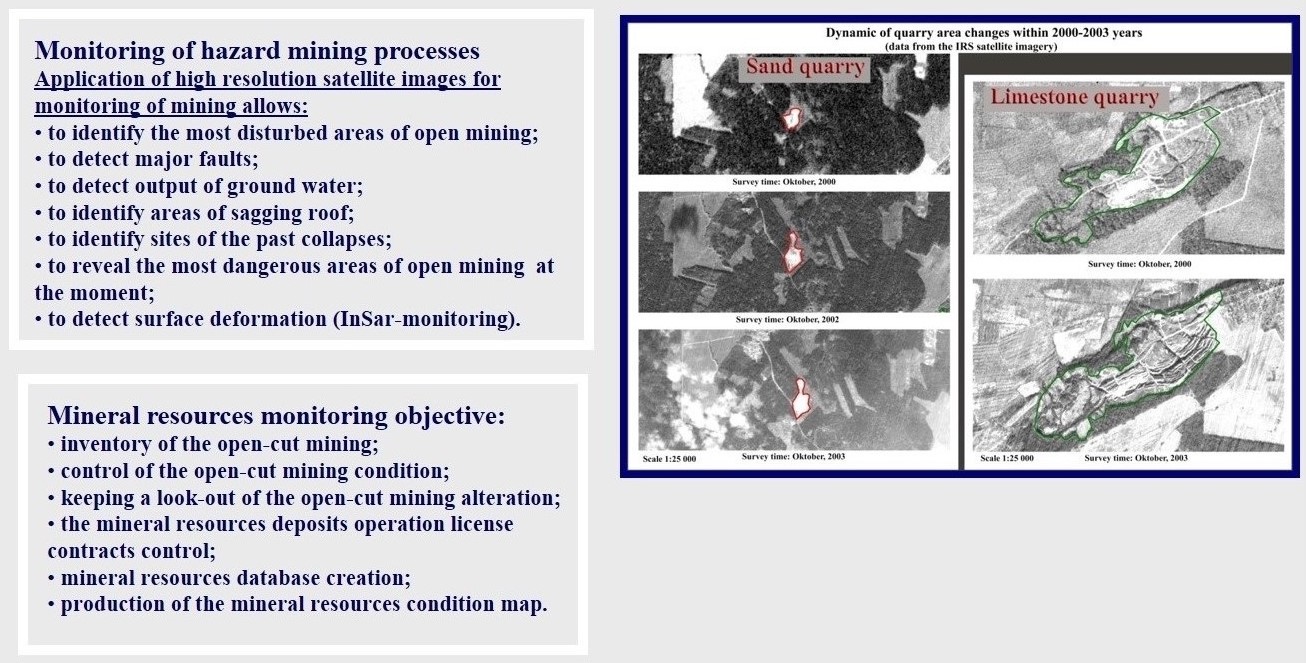
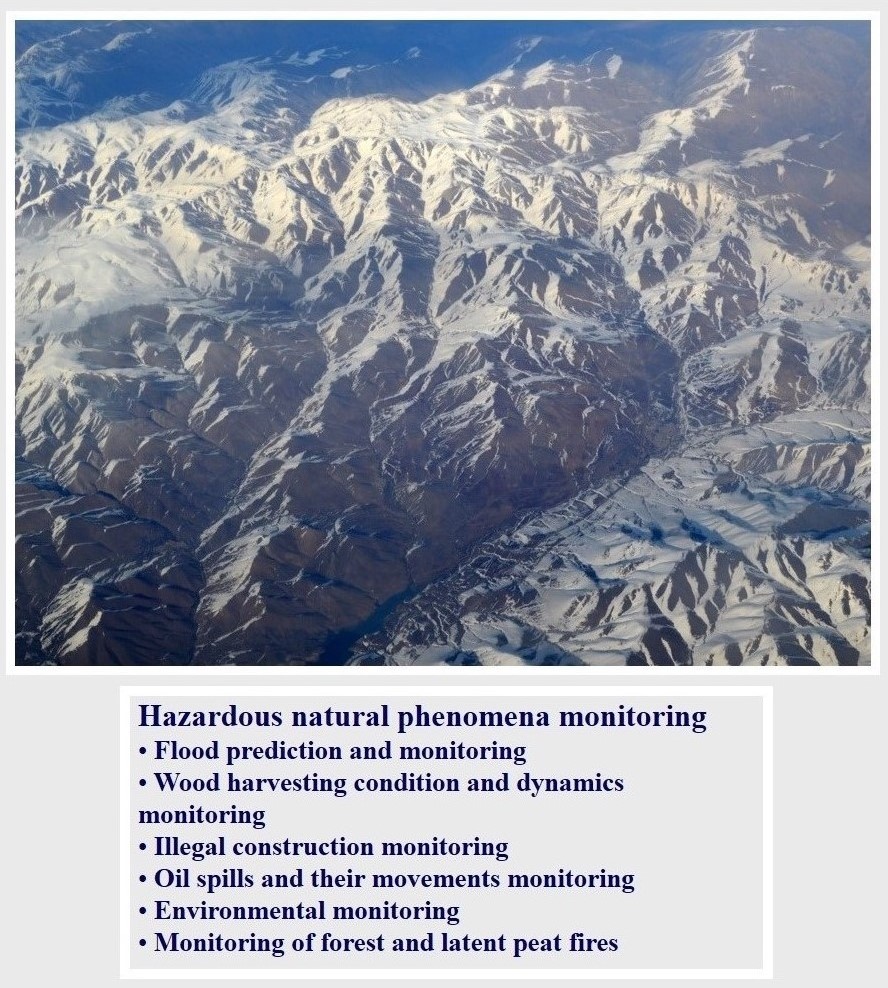
This can be studies of the state and dynamics of destruction of the walls of open mine workings, the phenomena of erosion and abrasion, the dynamics of volcanic activity, etc. Such work is not a priority for us, however, we have experience of this kind of projects.
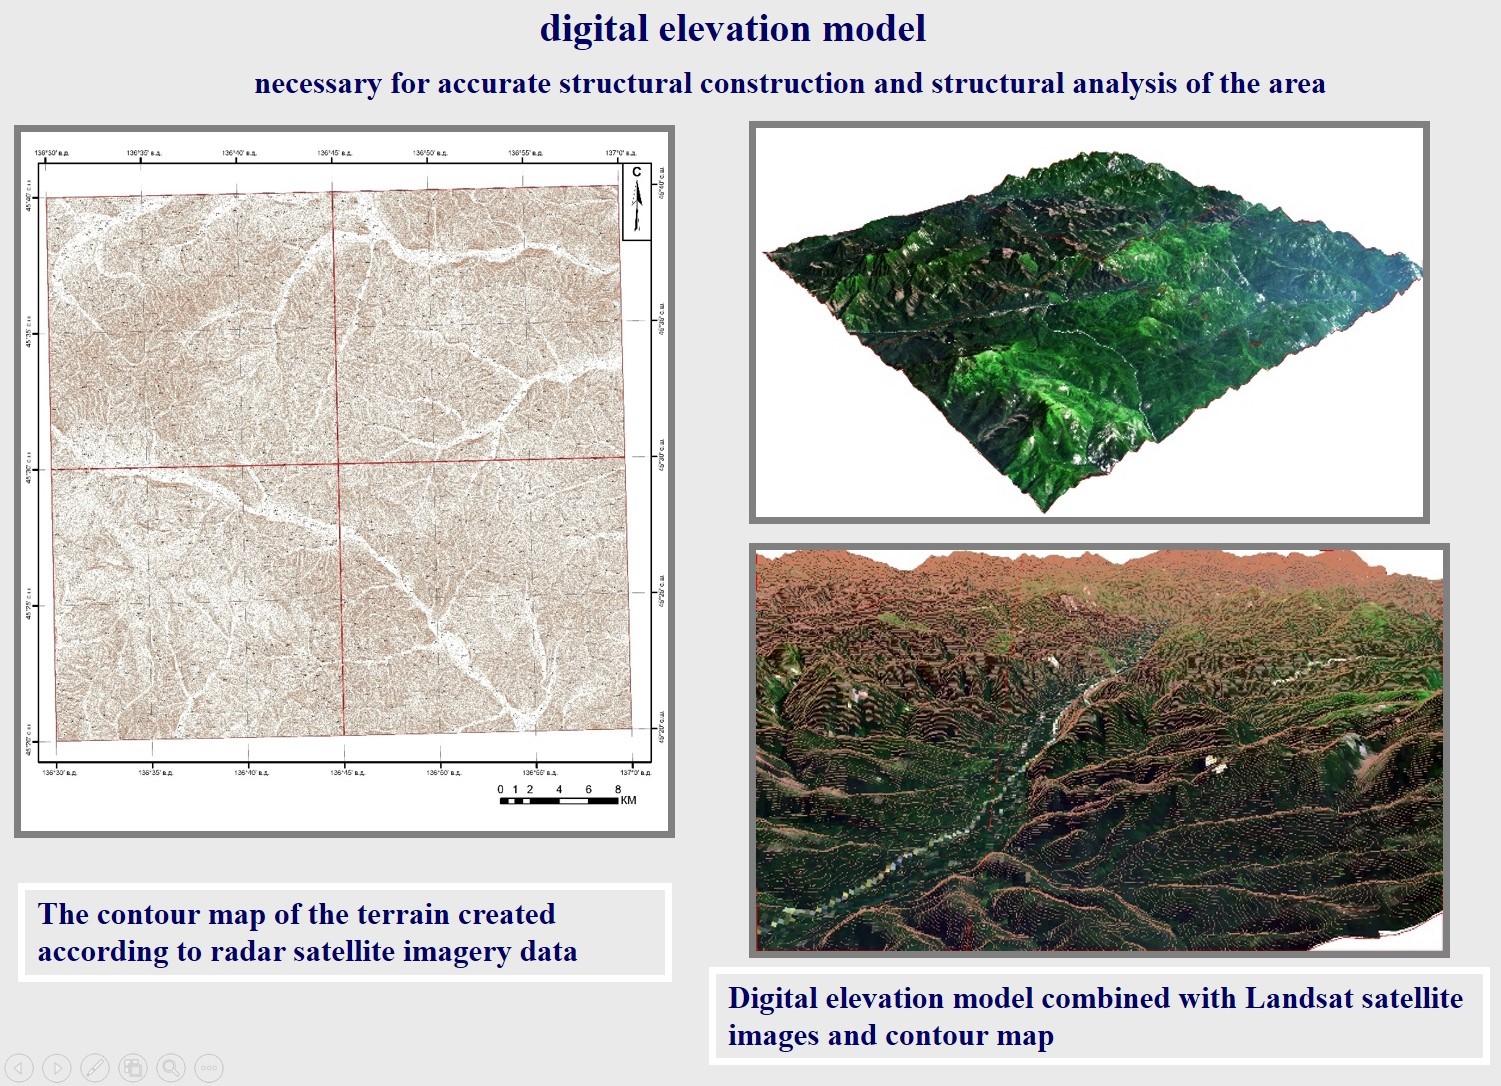
A digital elevation model (DEM) is created on the basis of only satellite data, as well as using satellite data in combination with ground-reference data (for high-precision large-scale DEM).
When constructing a DEM, the analysis and identification of the presence of various anomalies and artifacts of the relief and the correction of artifacts in areas that have insufficient satellite data coverage are accomplished. Also the procedure for smoothing the DEM to give more natural outlines characteristic of real relief, and eliminate the redundancy of data caused by the features of technology (satellite altimetry ) obtaining the initial data is carried out.
As a result of the work, a contour map and a three-dimensional digital elevation model are built.
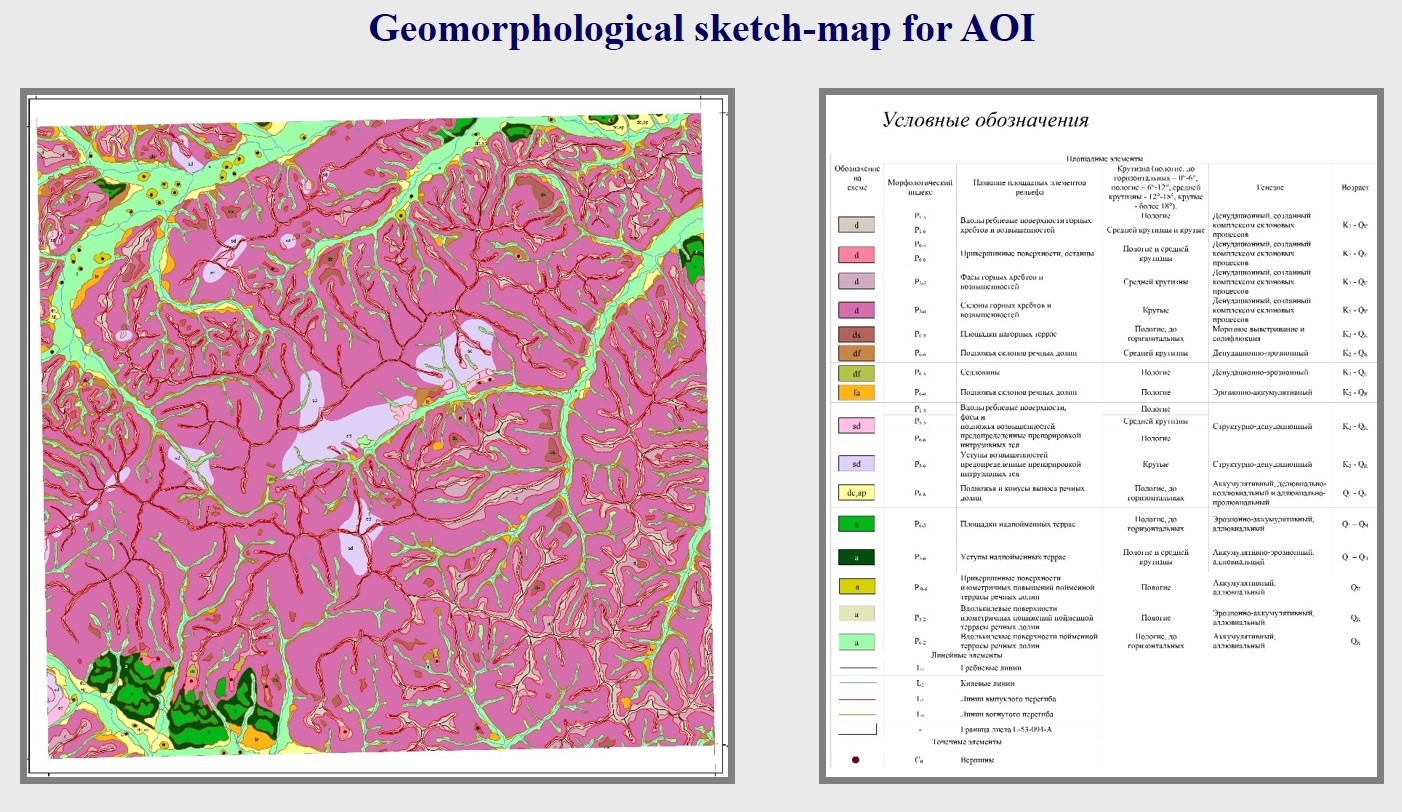
Geomorphological interpretation of remote sensing data (RSD) and analysis of the results is an important, often obligatory, part of forecasting work and provides additional information about the structure, history of development and the genesis of the relief. These data are taken into account in a comprehensive analysis of the prospects of the territory.
Geomorphological interpretation can be partial, aimed at solving a local problem in the project. For example, the task is to analyze the paths of possible drift of sedimentary material from the summit surfaces (ridges, individual peaks), as well as the nature of the accumulations of material (eluvial, deluvial alluvial deposits), which may contain a useful component. This requires a narrowly focused interpretation of space survey materials and, based on the interpretation results, the construction of the following geomorphological maps and diagrams:
- Map of the thalweg erosional network (of various orders), as well as the boundaries of river catchments of the study area;
- Scheme of erosional dissection of the relief (horizontal and vertical), characterizing the depth and density of the erosional incision, which will make it possible to conduct productive schlich sampling of the alleged placers;
- Map of the slope steepness as the main characteristic of the rate of drift of sedimentary material from the top and accumulation of the carried material containing the useful component;
- Residual elevation (relief) map and demolition map (rock volume removed) showing the potential rock volume that can be removed in the future by denudation and erosion processes.
- The slope exposure map showing the direction of the slope of the main transport streams and a map of solar insolation of slopes as one of the factors of physical weathering;
- Scheme of intensity of erosional dissection;
- Diagrams of base and summit surfaces, differences in base surfaces allowing to analyze and highlight areas of the latest tectonic uplifts and subsidence;
It is also possible, if there are high-quality resolution RSD and basic geological materials, a complete geomorphological interpretation with the compilation of a generally accepted geomorphological map. When compiling such geomorphological maps, State Requirements for Geomorphological Mapping are used.
The content of a geomorphological map is based on: genetically homogeneous relief surfaces, main geomorphological boundaries, wireframe relief elements, isohypses and isobaths. A detailed explanatory note is written to the map.
This work can be done as a standalone project, and also within the forecasting work.
Spectral analysis of remote sensing materials and lithological interpretation of the remote sensing data (RSD) are an additional source of information for identifying potentially promising areas.
Spectral analysis of RSD
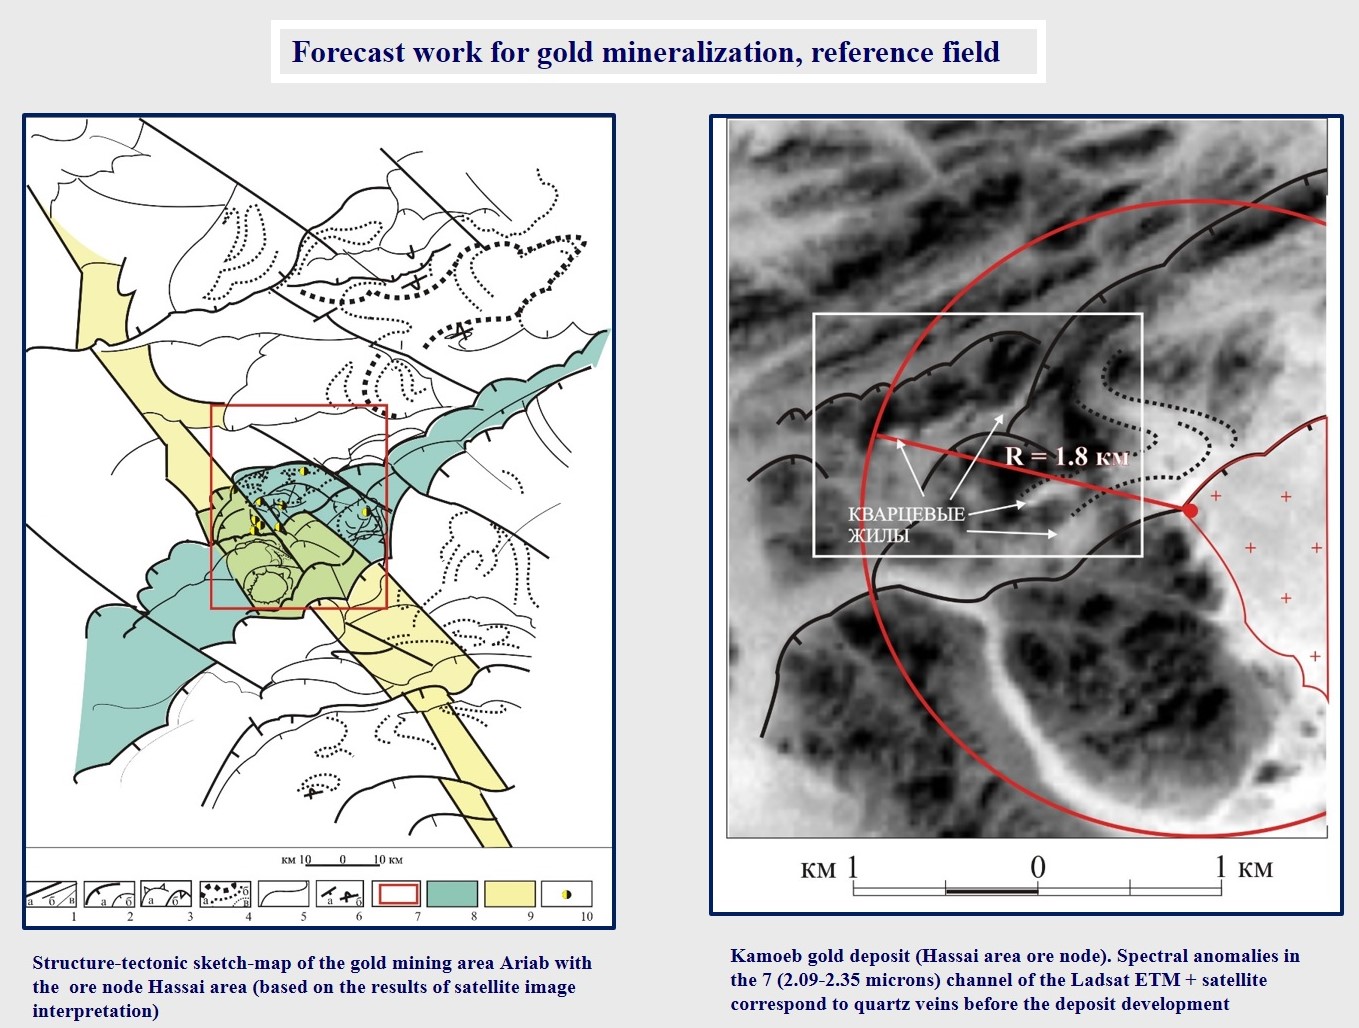
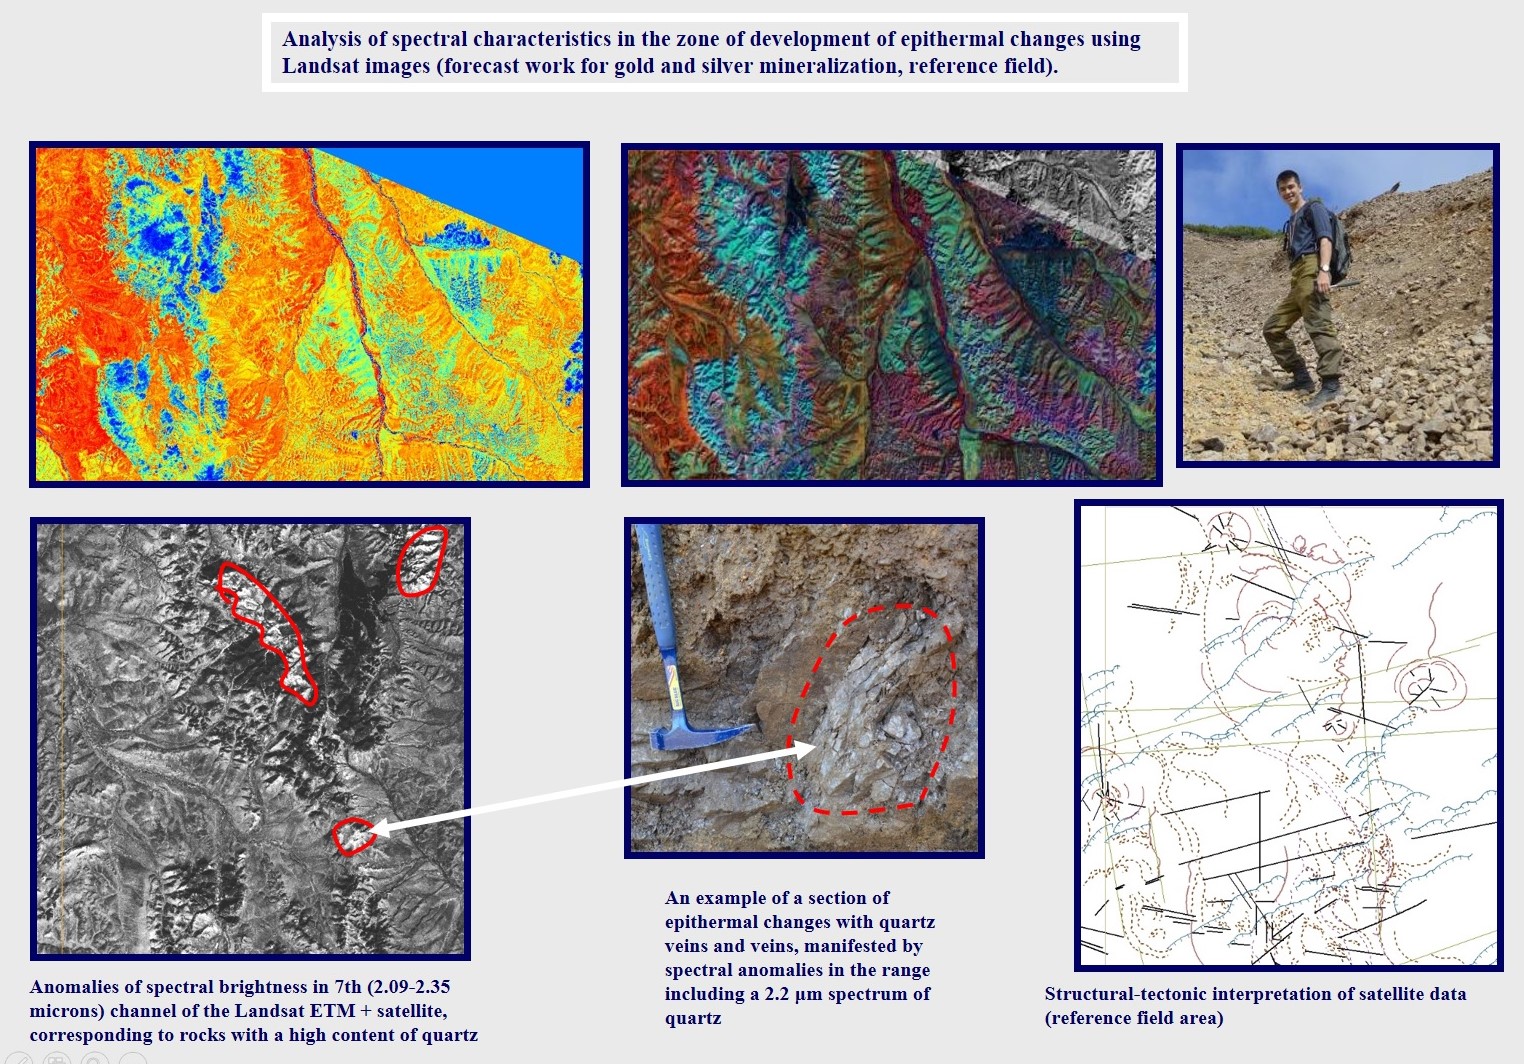
Modern methods make it possible to use multispectral and hyperspectral satellite imagery data to detect spectral and thermal anomalies in certain spectral zones, which suggests the possible presence of certain mineral complexes in these areas, indirectly indicating the ore potential.
Best of all, the spectral analysis method works for open areas of the arid, arctic and, in part, subarctic zones, where vegetation cover is poorly developed or completely absent.
For heavily forested areas (areas of rain forest development, taiga areas, deciduous forests, dense shrubbery, abundant herbaceous cover), spectral analysis can give incorrect results. This must be taken into account when interpreting the data of spectral analysis of such areas, or completely abandon this method when interpreting satellite images for forested areas.
The analysis of thermal anomalies is absolutely necessary in predictive work on the search for groundwater and thermal waters, as well as in the study of volcanically active regions (this is especially true for monitoring volcanic activity).
Lithological mapping
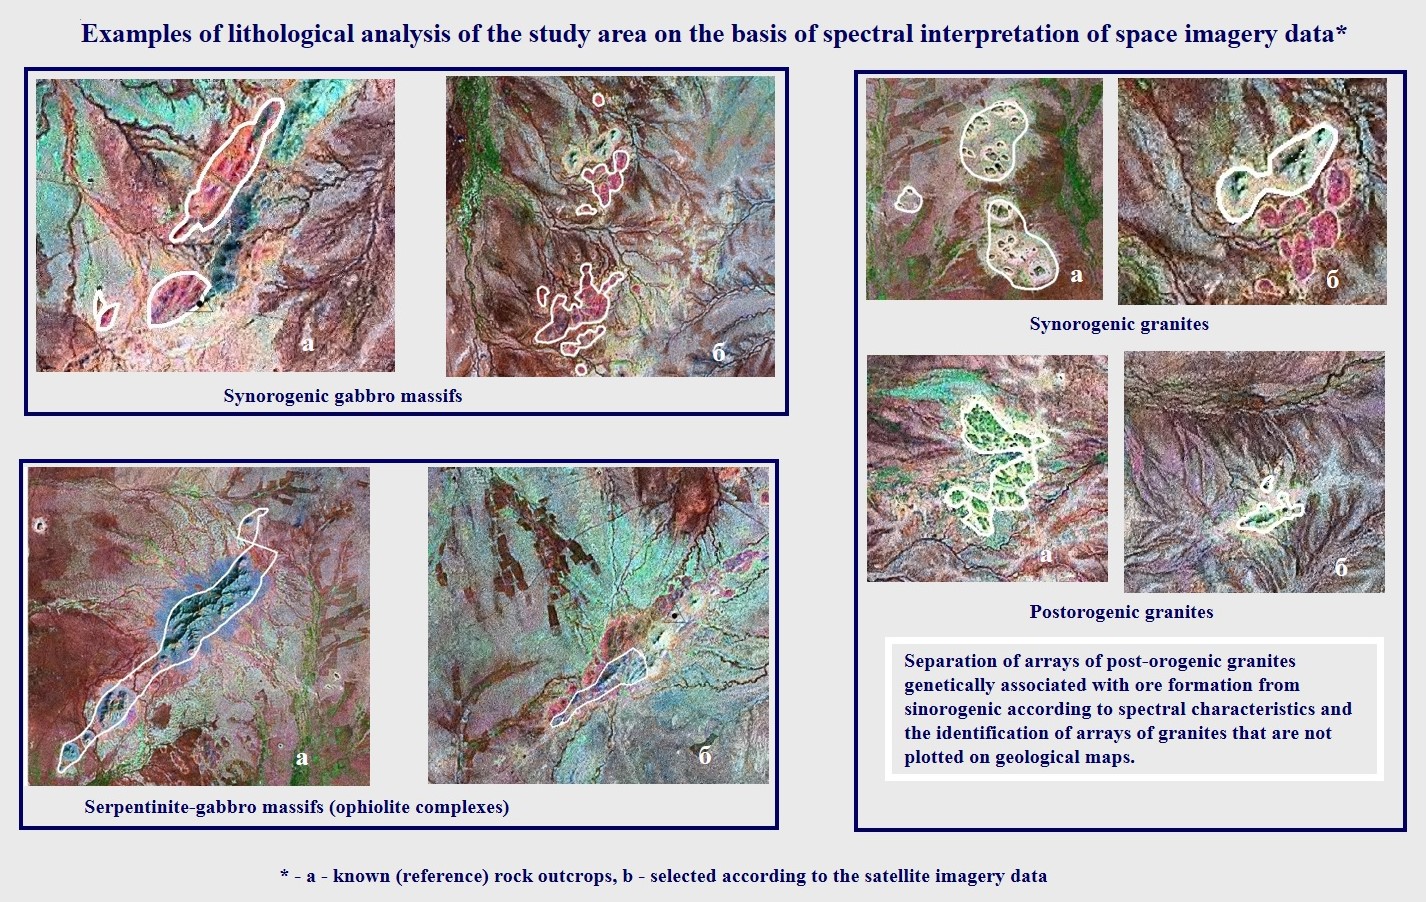
Lithological mapping based on RSD, as a rule, is an element of forecasting work in areas not covered with vegetation or with poorly developed vegetation.
Lithological mapping is important when detailed geological maps of the required scale are not available, and when the ore mineral is confined to certain rock massifs.
Usually, lithological analysis is local, aimed only at identifying and differentiating specific rock complexes.
Based on the experience of previous projects, such studies are often effective and carry important additional information that helps to identify the most interesting areas for searching for a mineral resource.
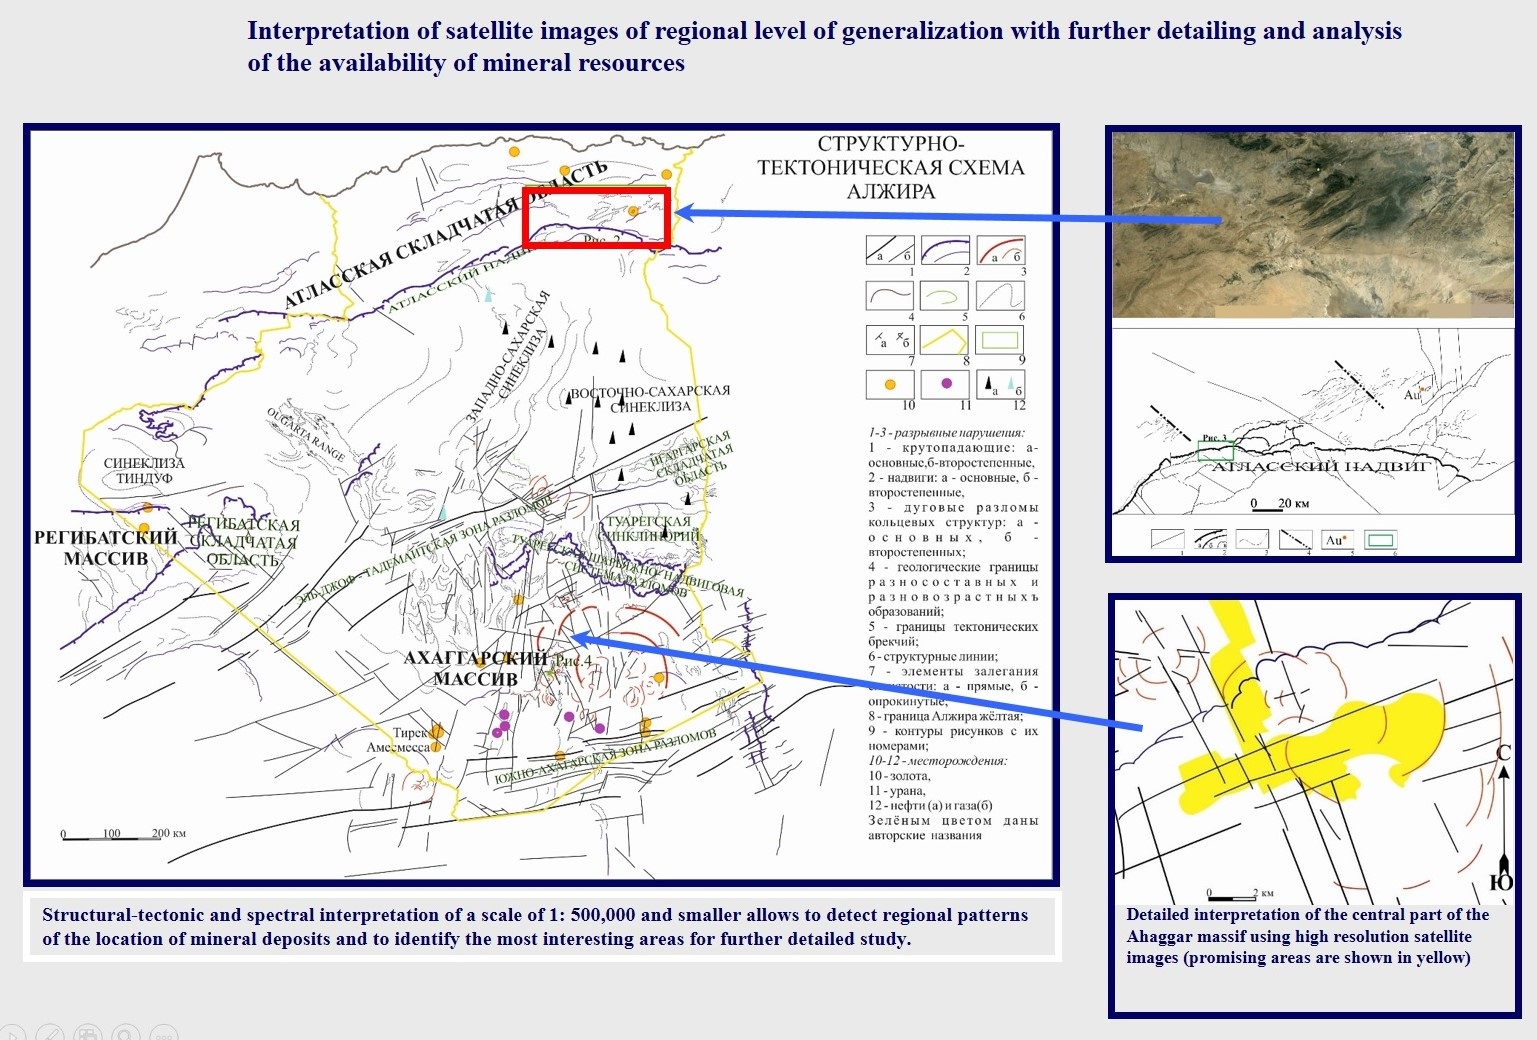
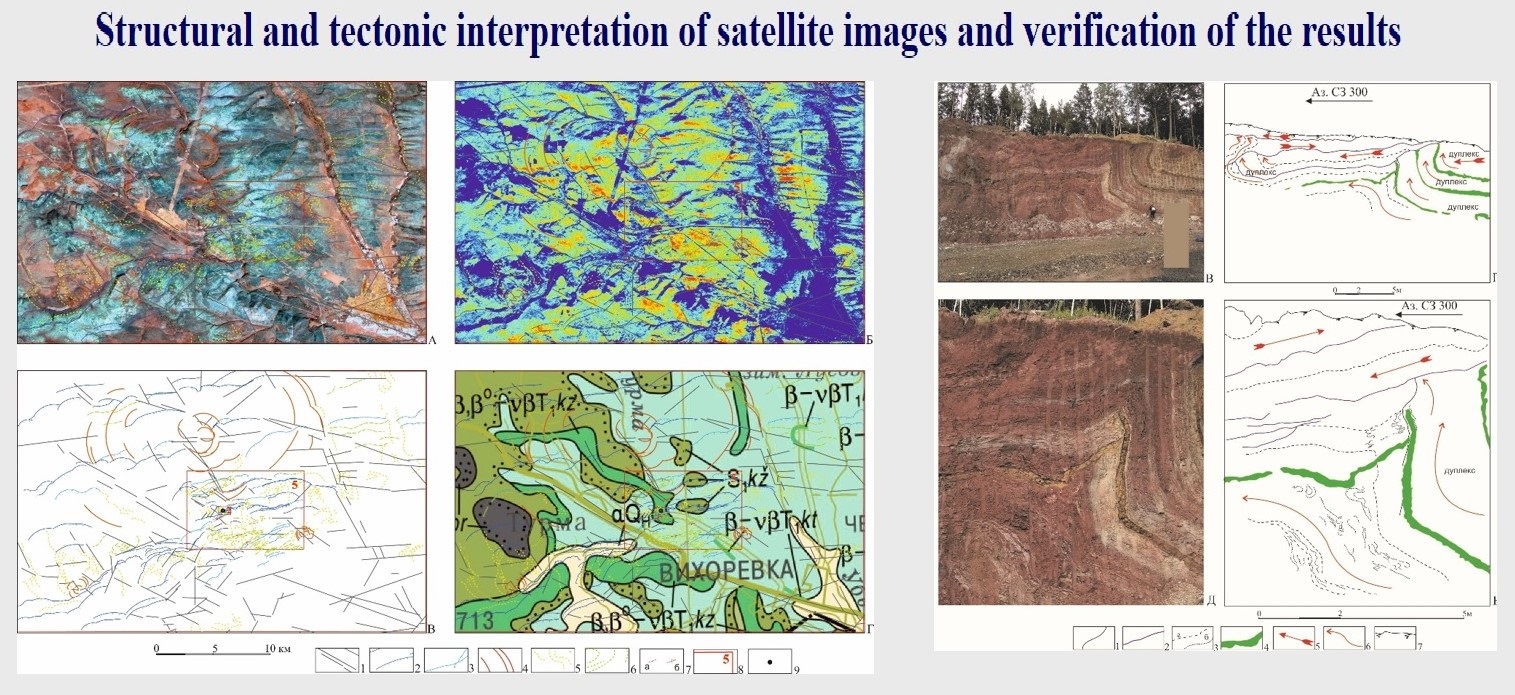
Structural-tectonic interpretation of remote sensing data (RSD) – alpha and omega of remote forecasting works.
Interpretation is always carried out simultaneously by several specialists, independently of each other, in order to minimize the factor of subjectivity.
The interpretation results are combined, identical elements are left on the resulting structural-tectonic sketch-map, non-coinciding elements are discussed collectively and, if they do not find a rational explanation, are removed from the final scheme. The interpretation structural-tectonic sketch-map is compared with topographic maps, and the elements that coincide with anthropogenic objects are excluded from the sketch-map.
The detail and variety of components of structural-tectonic interpretation depend on the quality of the remote sensing data (RSD), the scale of work, landscape features of the territory, landforms, density of vegetation cover, climate, the degree of anthropogenic interference in the natural landscape and other factors that determine the clarity of the display of surface elements and affect the possibilities of interpretation.
In the process of structural-tectonic interpretation, the following are revealed:
- steeply dipping linear discontinuities,
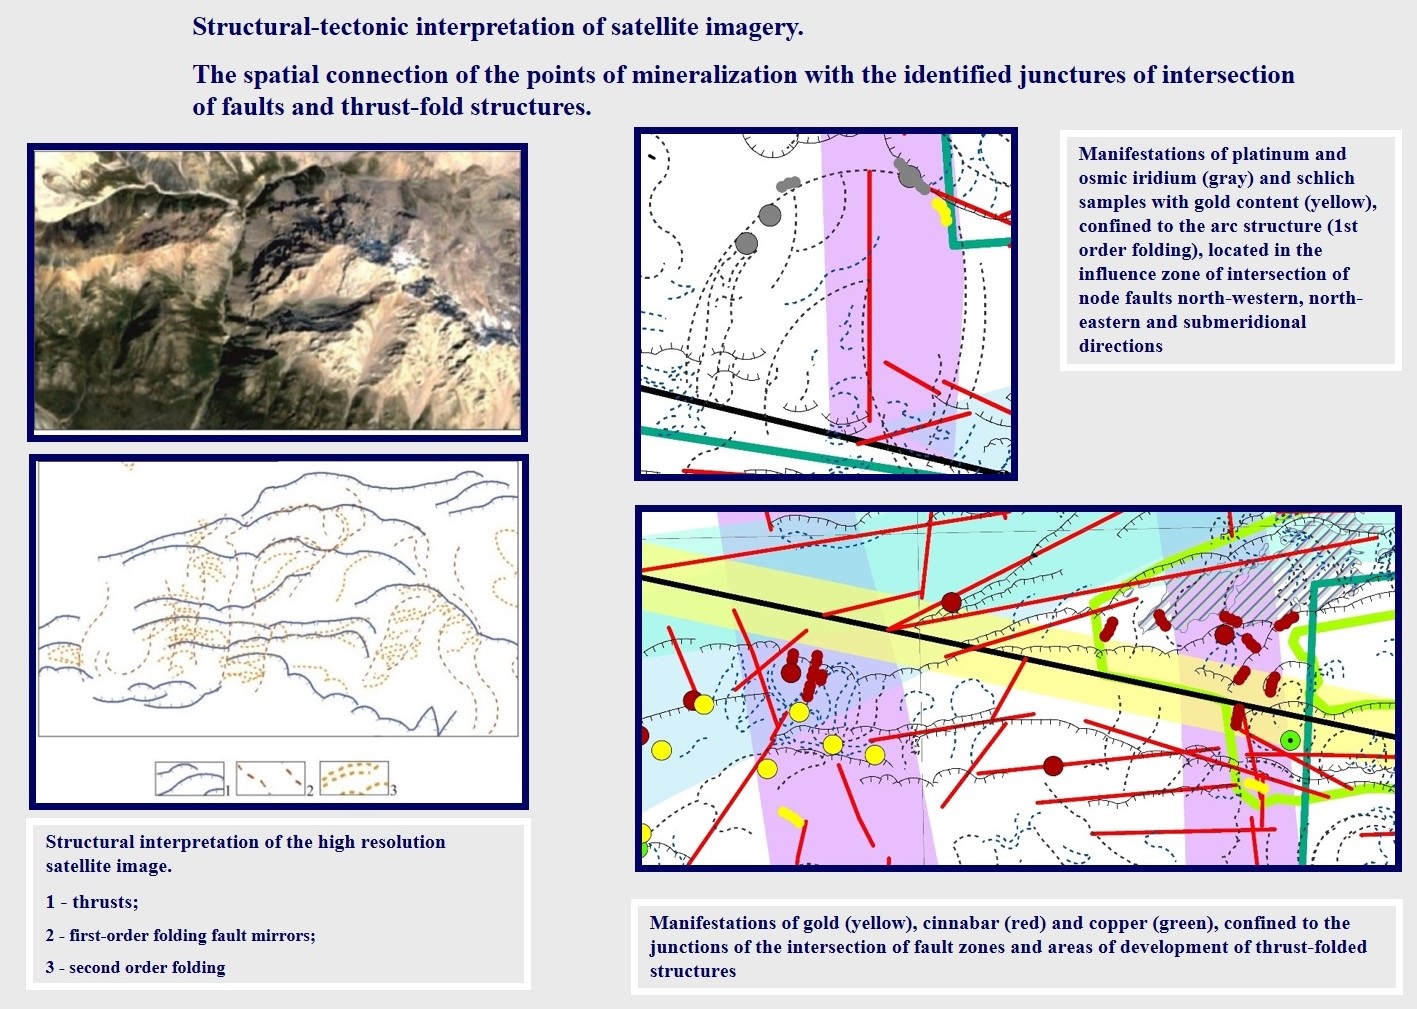
- gently dipping faults (thrusts),
- folding and fold-thrust systems,
- strike and dip of rock layers (only when using high resolution RSD)
- arc and ring structures
- fault systems
- generalized morphostructural elements (morphostructural blocks)
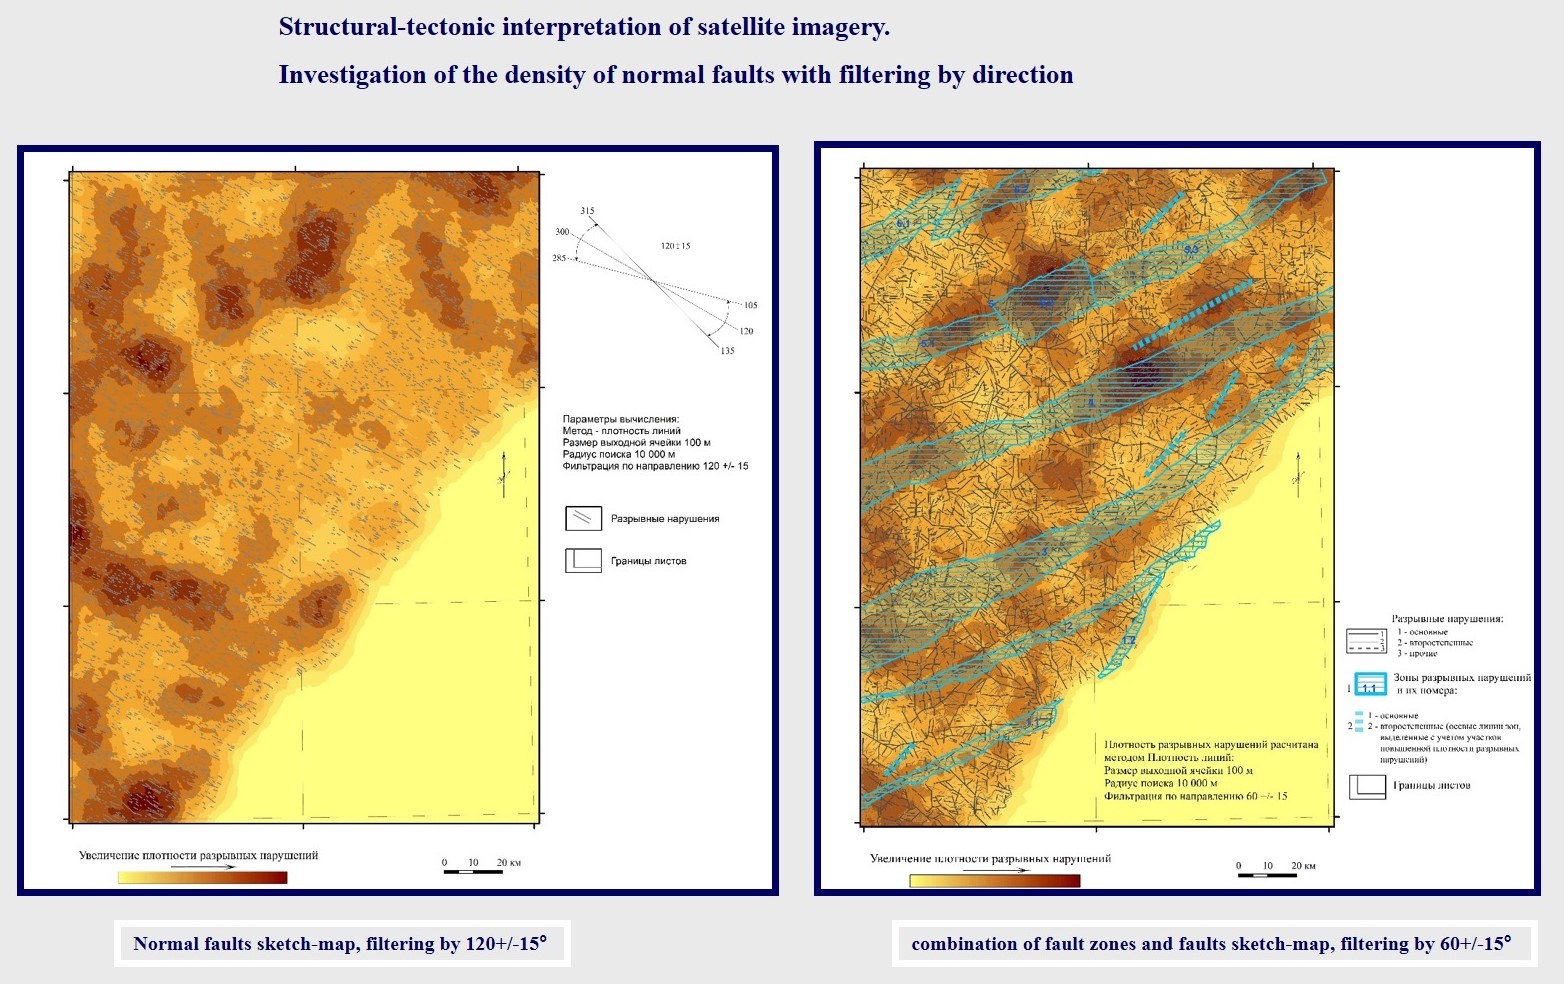
- other strucral features of the territoryAfter the decryption is completed, a statistical analysis of its results is carried out: the calculation of density characteristics by several parameters, the construction of a rose diagram of ruptures, and others. The types of processing of the decryption results are dictated by the tasks and characteristics of each specific project. Often such studies go beyond the scope of the technical assignment, since their necessity becomes clear only in the course of work.
The reliability of our structural-tectonic interpretation was repeatedly confirmed in the course of subsequent field work by reconnaissance routes, geophysical data, and drilling.
Upon completion of the structural-tectonic interpretation, structural-tectonic diagrams, diagrams of densities and systems of faults, and other thematic maps and diagrams are constructed.

Database formation:
Selection of remote sensing data (RSD) of various resolutions, different seasons and years of imaging, which meet the requirements for the remote basis of the State Geological Map, from the general array of works existing on the territory.
The selected data block is the base for the RSM selection when creating the satellite imagery based maps.
For the entire selected RSD array, a detailed register is compiled, which indicates the type of imaging system, year, survey time, cloudiness, solar altitude and azimuth, and other characteristics, as well as a scheme for covering the work area with satellite data.
Collection of existing geological, geochemical, geophysical and topographic data, maps, diagrams, field work results and other available information for the work area.
The collected information is systematized, analyzed, raster data is digitized and processed using specialized software products.
Formation of a GIS project (development of its structure and filling with collected raster and vector data).
Creation of satellite imagery based maps:
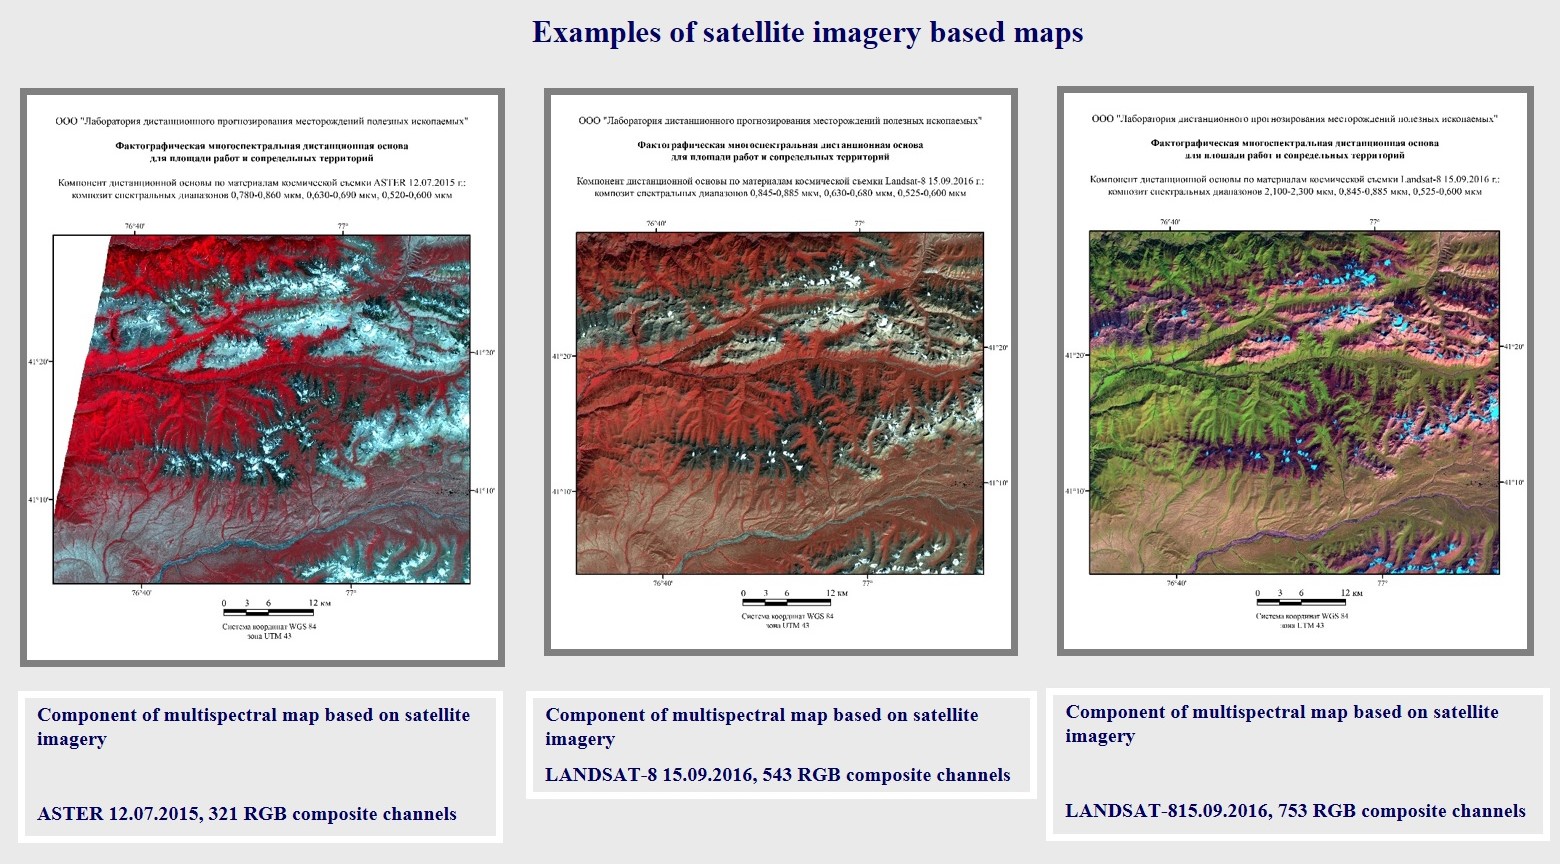
Factographic polychronic satellite imagery based maps (SIBM) are a set of per-channel images, as well as a set of images based on RGB composites for the work area.
The technology for creating such a map contains a number of operations. The original “raw” RSD are processed step by step and transformed for each spectral zone of the image. Then synthesized images are formed.
All distance frames we have created comply with the Requirements for distance frames for geological maps.
For all satellite imagery based maps, SIBM passports are generated. The SIBM passport contains technical information for each photograph: the name of the shooting system, the identification number of the scene, the date of the shooting, the cartogram.
As a rule, within the framework of a working project, SIBMs are made using satellite data from different years and several seasons of survey. This allows the most accurate, detailed and reliable deciphering and interpretation of space survey materials, as well as tracking changes in the landscape over time.
As a result, the customer receives an array of high-quality satellite imagery based maps for the area of interest.
The purpose of forecasting works is to identify, within an area of interest, potentially promising sites according to the interpretation of sattelite imagery data, characterized by a set of criteria indicating the possibility of localizing a mineral resource. According to experience, the area of such sites is from 5 to 20% of the study area. Outlined areas are heterogeneous in terms of the content of favorable cosmogeological signs of ore prospect and are ranked by priority for further prospecting.
In addition to the contours of promising areas, the customer receives an array of additional information about the structure and features of the area of work, often not reflected in the available geological and other specialized maps.
Thus, the client has the ability to localize exploration operations done on the ground, taking into account the results of a comprehensive forecasting studies. That, in turn, optimizes costs and significantly reduces the cost of prospecting.
The main mineral resouces we work with:
- copper
- iron
- precious metals (gold, silver, platinoids)
- diamonds
- building and decorative stone
- gems
- underground waters, including thermal
- uranium
- oil and gas
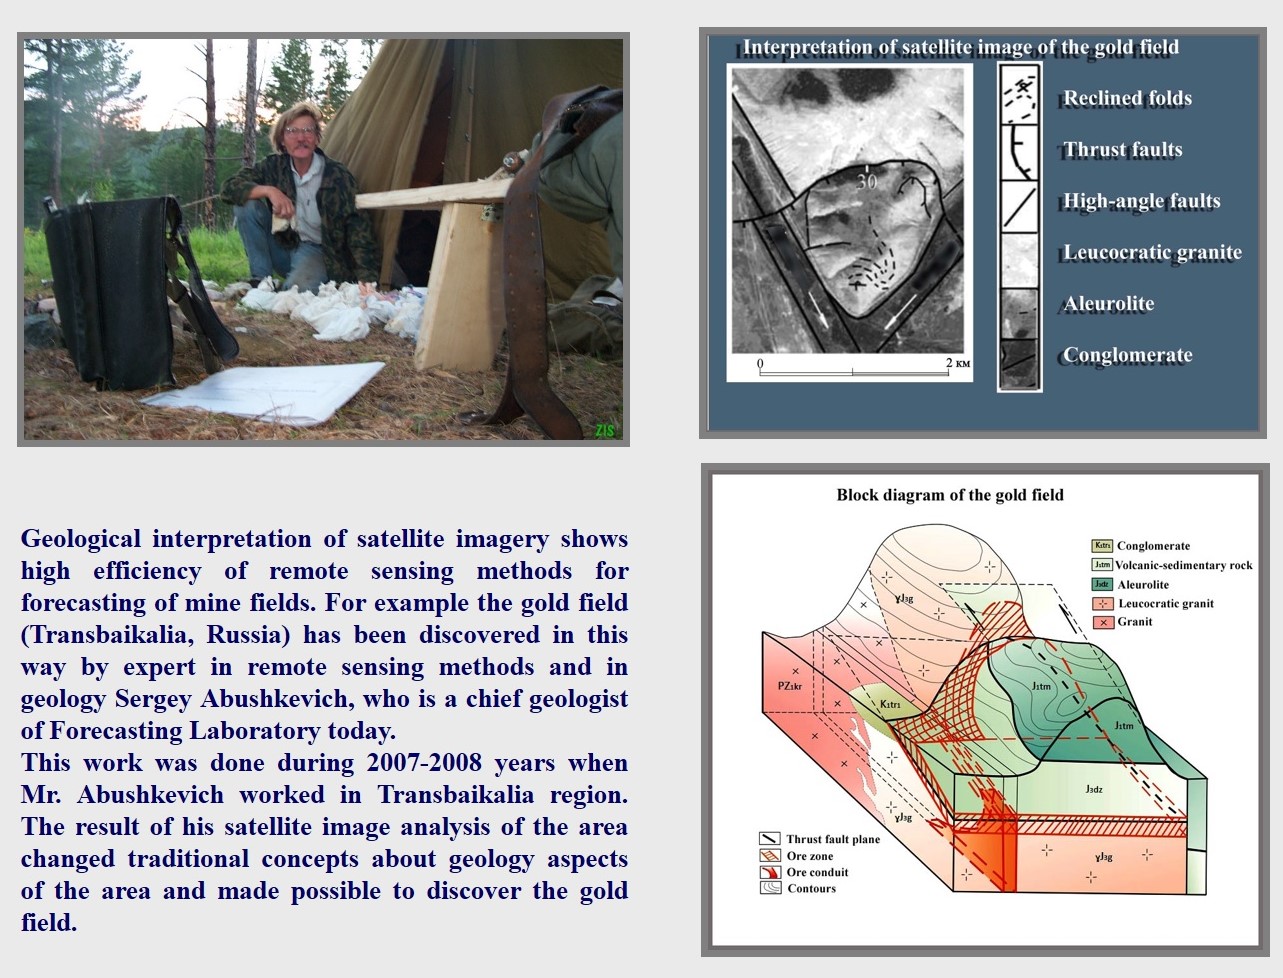
Our specialists have carried out numerous projects in various regions of Russia and abroad. As an example of successful work, one can cite the discovery of a gold ore deposit in Transbaikalia. The analysis of data from remote sensing of the Earth, carried out by S.A. Abushkevich showed a fundamentally new structural position of the ore body in the massif, which ultimately contributed to the discovery of the deposit.
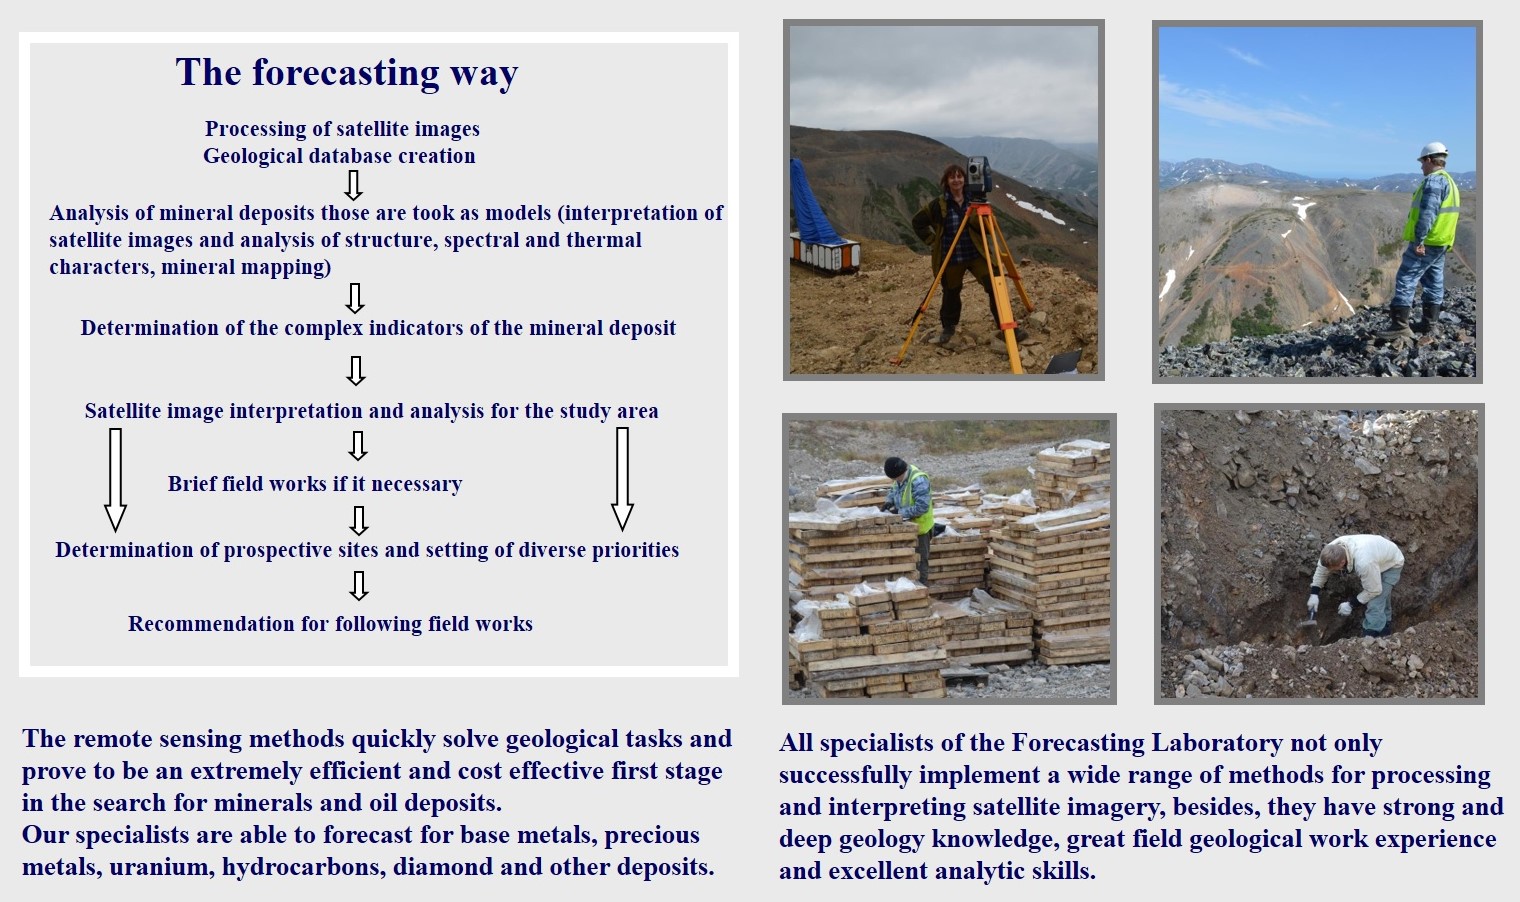
Each project implies its own necessary set of works, which is determined by the specifics of the task. There is a generalized research algorithm:
- creation of a database (both remote sensing data and geological and topographic data);
- processing of remote sensing materials (RSM) and production of factographic sattelite imagery based maps;
- satellite image interpretation within the work site, as well as reference objects;
- comprehensive analysis of interpretation results;
- determination of cosmogeological criteria of ore prospects for standard ore fields;
- identification of criteria of prospects within the work area and delineation of promising areas, ranked according to the degree of prospects.
These tasks include:
- structural and tectonic interpretation of the RSM;
- spectral analysis of RSM;
- geomorphological interpretation of RSM;
- lithological interpretation and mapping of RSM;
- building a digital elevation model;
- other types of work, based on a specific task.
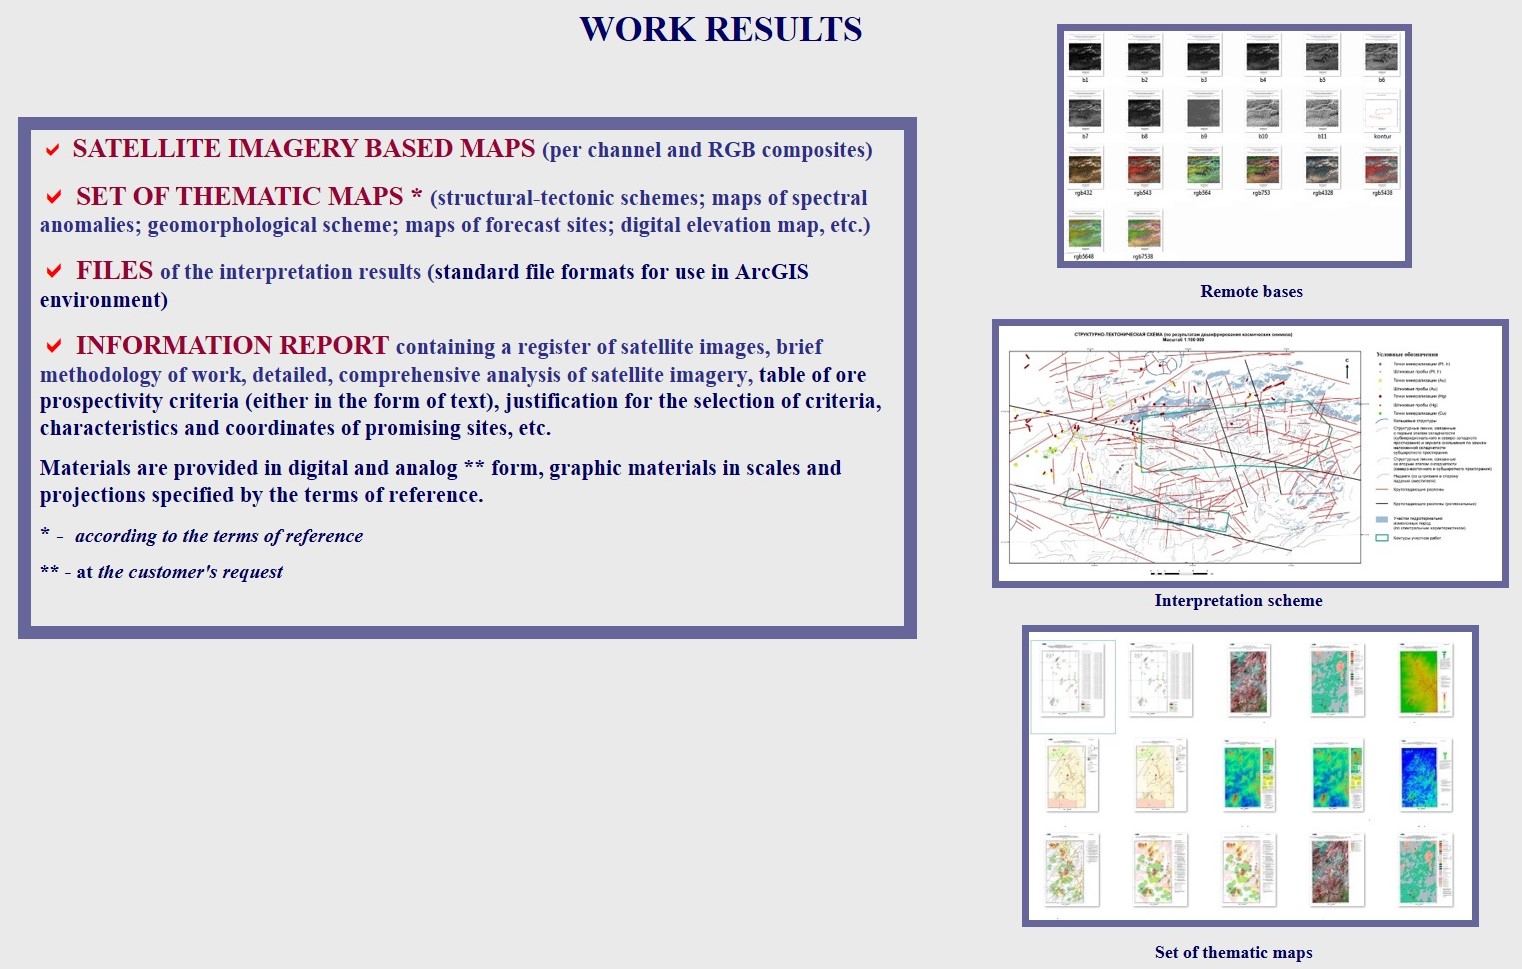
Based on the results obtained, the following are created:
- contour maps of the terrain;
- structure-tectonic sketch-maps;
- maps of spectral anomalies;
- digital elevation model;
- geomorphological maps;
- lithological sketch-maps;
- layouts of ore promising sites;
- other thematic maps and diagrams, the set of which is determined by the specific objectives of each project.